What single-family homes actually leased and sold for in Arlington over the last 90 days — read from the largest closed-transaction sample in our market coverage.

Most “Arlington rental market” pages quote a single portal estimate and stop there. This report reads the actual Multiple Listing Service record — 360 closed leases and 758 closed sales in Arlington over the trailing 90 days — and translates it into decisions an owner or investor can act on.
Arlington is the largest, deepest, and most diversified rental market in our coverage: a stable core-holding market where scale creates liquidity and pricing precision creates returns. Here is where it stands at mid-year 2026.
The Arlington Rental Market at a Glance
| Metric | Value | Metric | Value |
|---|---|---|---|
| Median lease | $2,195 | Median home sale | $343,000 |
| Median time to lease | 24 days | Median sale / sq ft | $181 |
| Median rent / sq ft | $1.32 | Gross yield · 3-bed | 8.0% |
The One-Sentence Version
Over the trailing 90 days, single-family homes in Arlington leased at a $2,195 median in a median of 24 days, while comparable homes sold at a $343,000 median — producing a three-bedroom gross rental yield near 8.0% in the largest, most liquid single-family rental market between Dallas and Fort Worth.
Rental Leasing Activity
Arlington recorded 360 closed leases over the trailing 90 days — by far the largest lease sample in our market coverage, which makes these medians unusually robust. The median rent was $2,195 (mean $2,314), at roughly $1.32 per square foot on a 1,651-square-foot median home. The pricing signal is healthy: 59% of homes leased at or above their original asking rent, while 41% took a reduction averaging about $158 (6.2%). Homes leased quickly — a 24-day median (mean 35).
That combination — a large, fast-moving market where a clear majority of correctly priced homes lease at or above ask — is what liquidity looks like. It also means the penalty for mispricing is sharp: in a market moving this fast, a home priced to a portal estimate rather than the closed comps gives back real weeks of vacancy.
Rent by Bedroom
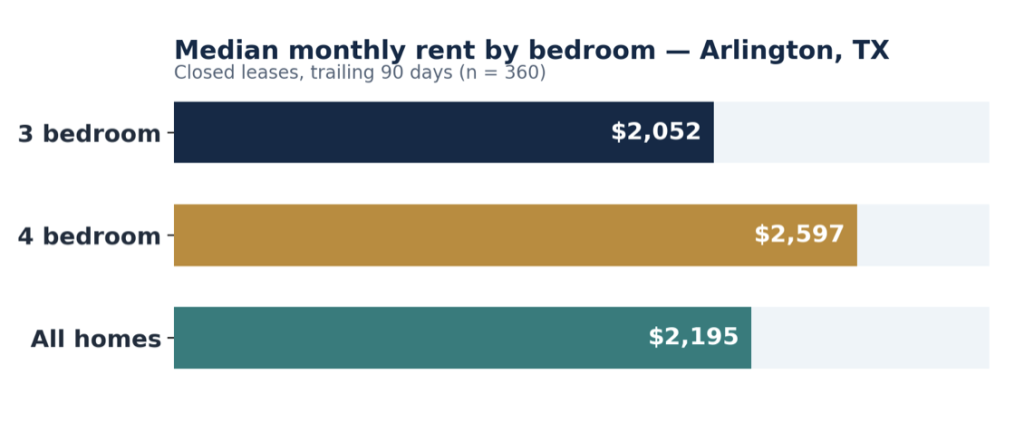
| Bedrooms | Closed leases | Median rent | Median DOM | Rent / sq ft |
|---|---|---|---|---|
| 3 bedrooms | 260 | $2,052 | 23 | $1.34 |
| 4 bedrooms | 88 | $2,597 | 28 | $1.22 |
| 5 bedrooms | 4 | $2,732 | 36 | $1.19 |
| All homes | 360 | $2,195 | 24 | $1.32 |
Three-bedroom homes are the backbone of the market at 72% of closed leases; four-bedroom homes carry a clear premium. Two- and five-bedroom homes are thin segments.
The Active Pipeline
There are 168 rental homes actively listed in Arlington at a $2,300 median asking rent and a fast 16-day median days-on-market. Active asking sits above the $2,195 closed median, so expect the market to trim part of any premium in the first few weeks unless a home is genuinely differentiated by condition, size, or school district.
For-Sale Market Context
Over the trailing 90 days, 758 single-family homes closed in Arlington at a median price of $343,000 ($181 per square foot) on a 1,907-square-foot median, in a median of just 20 days on market. 40% sold at or above asking, and the median seller gave back about $5,000 (1.7%) from the original list — a balanced, efficient resale market. Arlington’s mid-range pricing is part of its appeal to investors: entry costs sit above the value Mid-Cities suburbs but well below newer submarkets, while rents support a solid yield.
Source: 758 closed Arlington sale transactions, trailing 90 days ending July 2026. Median year built among sold homes: 1984.
| Segment | Median sale price | Median rent | Gross yield |
|---|---|---|---|
| 3-bedroom | $309,000 | $2,052 | 8.0% |
| 4-bedroom | $393,000 | $2,597 | 7.9% |
| 5-bedroom | $497,500 | $2,732 | 6.6% |
Gross Rental Yield by Segment
Pairing the trailing-90-day median rent against the trailing-90-day median sale price by bedroom gives the cleanest yield read for the current market:
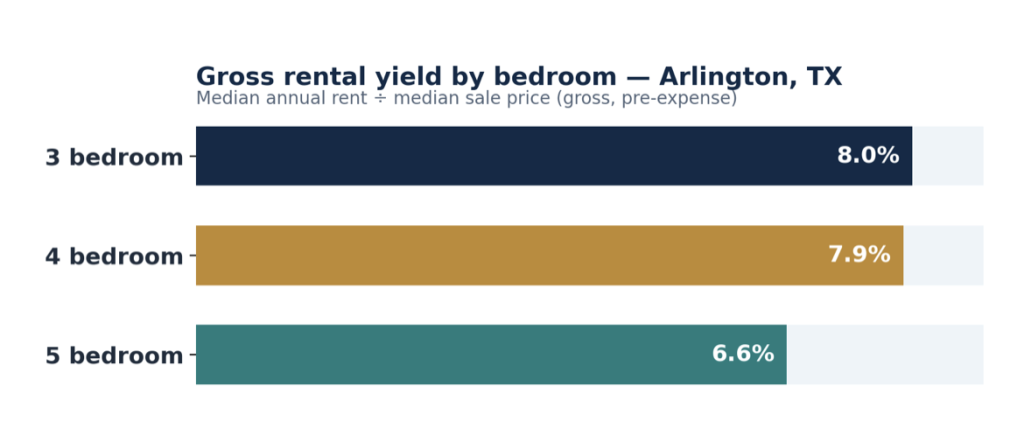
Three- and four-bedroom homes are essentially tied at the top, near 8.0% and 7.9% gross yield respectively, with the three-bedroom segment offering the most accessible entry price ($309,000 median). That places Arlington’s core yield above the pricier suburbs of Mansfield and North Richland Hills and just behind the small-city value markets of Watauga and Haltom City — the difference being that Arlington delivers it at far greater scale and liquidity. These are gross figures, before vacancy, taxes, insurance, capex, and management.
What Flat-Fee Management Means in Arlington
Most Arlington property managers charge 8%–10% of collected rent. McCaw’s Full-Service Management is a $175 flat monthly fee. At Arlington’s $2,195 median rent, that is an effective rate of about 8.0% — and because the fee is fixed, it never rises when your rent does. On a four-bedroom home at $2,597 it is already 6.7%.
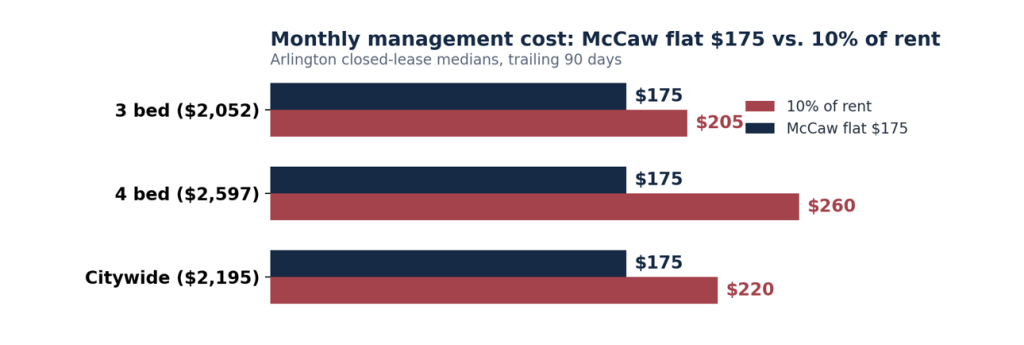
The difference compounds. On a four-bedroom home at the $2,597 median, a 10% fee is $260 a month — $85 more than McCaw’s flat $175, or over $1,000 a year — and unlike a percentage, the flat fee never climbs as your rent grows.
What’s Driving Demand
Scale and diversification. Arlington is home to roughly 395,000 residents — the largest city in our coverage and one of the largest in Texas — sitting squarely between Dallas and Fort Worth. That size produces a deep, continuously refreshing pool of rental demand that no single employer or industry defines.
A broad institutional employment base. Demand is anchored by major institutions: the University of Texas at Arlington (one of the state’s largest universities), the General Motors Arlington Assembly plant, Texas Health Resources and other major hospital systems, Arlington ISD, and the nationally known entertainment district — AT&T Stadium, Globe Life Field, Six Flags Over Texas, and Texas Live! Together they insulate the rental market from any single-sector downturn.
Central access and new supply. Interstates 20 and 30, State Highway 360, and US-287 place most of the metroplex within a short commute. On the supply side, master-planned communities such as Viridian and new build-to-rent developments have raised the marketing and finish standard — the bar an individual owner’s listing now competes against.
What it Means if You Own Here
1. This Is a Core-Holding Market – Scale, liquidity, and diversified demand make Arlington a stable foundation for a rental portfolio — not the highest-yield play in the region, but the deepest and most resilient, with fast lease-up when a home is priced right.
2. Price by ZIP and School District, Not Citywide – Five school districts cross Arlington’s city limits and its ZIP codes run 76001–76018, so a single citywide average can mislead. Anchor rent to the closed comps for the specific area and district — the difference is weeks of vacancy.
3. Underwrite for Mature Stock –With a median home built around 1984, Arlington rewards proactive maintenance on aging systems — HVAC, roofs, and plumbing — both to protect the asset and to keep a home in the 59% that lease at or above ask.
Curious what your specific property would lease for?
A recommended market rent built from this quarter’s closed comps, by ZIP and school district. Call (817) 491-2553.
Get a Free Rental AnalysisArlington Rental Market — FAQ
What is the Average Rent for a Single-Family Home in Arlington, TX?
Over the trailing 90 days, the median rent across 360 closed Arlington leases was $2,195/month (mean $2,314), about $1.32 per square foot on a 1,651-square-foot median home. By bedroom, the medians were roughly $2,052 (3-bed), $2,597 (4-bed), and $2,732 (5-bed).
How Fast are Rental Homes Leasing in Arlington?
The median closed lease went from listing to lease in just 24 days (mean 35), reflecting a deep, liquid market. About 59% of homes leased at or above their original asking rent, while 41% took a reduction averaging about $158 (6.2%) — which is why pricing to the closed comps on day one matters.
Is Arlington a Good Market for Rental Investment?
On the data, Arlington is a strong core-holding market: a three-bedroom gross yield near 8.0%, fast 24-day lease-up, and demand diversified across the University of Texas at Arlington, the GM Assembly plant, major hospitals, and the entertainment district. It is not the highest-yield market in the region, but it is the largest and most liquid, which lowers vacancy and resale risk.
What are Home Prices Doing in Arlington?
758 homes closed at a $343,000 median ($181 per square foot) in a median of 20 days over the trailing 90 days, with 40% selling at or above asking and a median give-back of about $5,000 (1.7%) from original list — a balanced, efficient market. By bedroom, medians were roughly $309,000 (3-bed), $393,000 (4-bed), and $497,500 (5-bed).
How Much Does Property Management Cost in Arlington, TX?
Most Arlington managers charge 8%–10% of monthly rent. McCaw Property Management charges a $175 flat monthly fee on Full-Service management — about 8.0% at the $2,195 median rent, dropping to about 6.7% on a four-bedroom home at $2,597. Because the fee is flat, it never rises as your rent grows.
What is the Gross Rental Yield in Arlington?
Based on closed MLS data, three-bedroom homes produced a gross rental yield near 8.0% (a $2,052 median rent against a $309,000 median sale price), with four-bedroom homes close behind at 7.9%. These are gross figures before vacancy, taxes, insurance, capital expenditure, and management.
Which School Districts Serve Arlington Rentals?
Five school districts cross Arlington’s city limits — Arlington ISD (the primary district), plus portions served by Mansfield ISD, Hurst-Euless-Bedford ISD, Kennedale ISD, and Grand Prairie ISD. Because attendance boundaries cross ZIP codes, the assigned campuses should be confirmed for each specific address; McCaw presents school information as objective, publicly reported data for all prospective applicants equally.
Should I Lease or Sell My Arlington Home?
Both markets are active and efficient — homes are selling in a median of 20 days near 98% of list, while three-bedroom homes lease in 24 days at $2,195 for a solid ~8.0% gross yield. Leasing captures that yield and holds a liquid, appreciating asset in the metroplex core; selling realizes equity now. A side-by-side lease-vs-sell analysis compares both on the numbers.
Author
Kyle McCaw is the founder and broker of McCaw Property Management and a Texas licensed real estate broker (License #0562767). He has been investing in and managing single-family rentals across the Dallas–Fort Worth metroplex since 2003, and personally owns a portfolio of single-family rental homes — so the strategy on this page comes from an owner who underwrites the same deals our clients do.
Kyle is an active member of the National Association of Residential Property Managers (NARPM) and has spoken at several national conferences across the single-family rental management and investing industries. McCaw Property Management is rated the #1 property management company in the Roanoke / DFW Metroplex by PropertyManagement.com and has been named to Texas A&M University’s Aggie 100 list of fastest-growing Aggie-owned businesses five times.